| Table of Contents |
| 1. Introduction 2. Sensors 3. Microwaves |
4. Image Analysis |
| 5. Applications |
Fundamentals of Remote Sensing
4.1 Introduction

In order to take advantage of and make good use of remote sensing data, we must be able to extract meaningful information from the imagery. This brings us to the topic of discussion in this chapter - interpretation and analysis - the sixth element of the remote sensing process which we defined in Chapter 1. Interpretation and analysis of remote sensing imagery involves the identification and/or measurement of various targets in an image in order to extract useful information about them. Targets in remote sensing images may be any feature or object which can be observed in an image, and have the following characteristics:
- Targets may be a point, line, or area feature. This means that they can have any form, from a bus in a parking lot or plane on a runway, to a bridge or roadway, to a large expanse of water or a field.
- The target must be distinguishable; it must contrast with other features around it in the image.

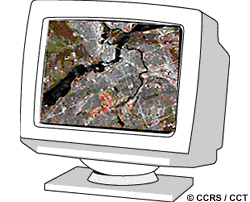
Much interpretation and identification of targets in remote sensing imagery is performed manually or visually, i.e. by a human interpreter. In many cases this is done using imagery displayed in a pictorial or photograph-type format, independent of what type of sensor was used to collect the data and how the data were collected. In this case we refer to the data as being in analog format.  As we discussed in Chapter 1, remote sensing images can also be represented in a computer as arrays of pixels, with each pixel corresponding to a digital number, representing the brightness level of that pixel in the image. In this case, the data are in a digital format. Visual interpretation may also be performed by examining digital imagery displayed on a computer screen. Both analogue and digital imagery can be displayed as black and white (also called monochrome) images, or as colour images (refer back to Chapter 1, Section 1.7) by combining different channels or bands representing different wavelengths.
When remote sensing data are available in digital format, digital processing and analysis may be performed using a computer. Digital processing may be used to enhance data as a prelude to visual interpretation. Digital processing and analysis may also be carried out to automatically identify targets and extract information completely without manual intervention by a human interpreter. However, rarely is digital processing and analysis carried out as a complete replacement for manual interpretation. Often, it is done to supplement and assist the human analyst.
Manual interpretation and analysis dates back to the early beginnings of remote sensing for air photo interpretation. Digital processing and analysis is more recent with the advent of digital recording of remote sensing data and the development of computers. Both manual and digital techniques for interpretation of remote sensing data have their respective advantages and disadvantages. Generally, manual interpretation requires little, if any, specialized equipment, while digital analysis requires specialized, and often expensive, equipment. Manual interpretation is often limited to analyzing only a single channel of data or a single image at a time due to the difficulty in performing visual interpretation with multiple images. The computer environment is more amenable to handling complex images of several or many channels or from several dates. In this sense, digital analysis is useful for simultaneous analysis of many spectral bands and can process large data sets much faster than a human interpreter. Manual interpretation is a subjective process, meaning that the results will vary with different interpreters. Digital analysis is based on the manipulation of digital numbers in a computer and is thus more objective, generally resulting in more consistent results. However, determining the validity and accuracy of the results from digital processing can be difficult.
It is important to reiterate that visual and digital analyses of remote sensing imagery are not mutually exclusive. Both methods have their merits. In most cases, a mix of both methods is usually employed when analyzing imagery. In fact, the ultimate decision of the utility and relevance of the information extracted at the end of the analysis process, still must be made by humans.
| Updated2002-08-21 | Important Notices |