| Table of Contents |
| 1. Introduction 2. Sensors 3. Microwaves |
4. Image Analysis |
| 5. Applications |
Fundamentals of Remote Sensing
4.5 Image Enhancement
Enhancements are used to make it easier for visual interpretation and understanding of imagery. The advantage of digital imagery is that it allows us to manipulate the digital pixel values in an image. Although radiometric corrections for illumination, atmospheric influences, and sensor characteristics may be done prior to distribution of data to the user, the image may still not be optimized for visual interpretation. Remote sensing devices, particularly those operated from satellite platforms, must be designed to cope with levels of target/background energy which are typical of all conditions likely to be encountered in routine use. With large variations in spectral response from a diverse range of targets (e.g. forest, deserts, snowfields, water, etc.) no generic radiometric correction could optimally account for and display the optimum brightness range and contrast for all targets. Thus, for each application and each image, a custom adjustment of the range and distribution of brightness values is usually necessary.
 In raw imagery, the useful data often populates only a small portion of the available range of digital values (commonly 8 bits or 256 levels). Contrast enhancement involves changing the original values so that more of the available range is used, thereby increasing the contrast between targets and their backgrounds. The key to understanding contrast enhancements is to understand the concept of an image histogram. A histogram is a graphical representation of the brightness values that comprise an image. The brightness values (i.e. 0-255) are displayed along the x-axis of the graph. The frequency of occurrence of each of these values in the image is shown on the y-axis.
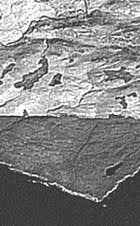
By manipulating the range of digital values in an image, graphically represented by its histogram, we can apply various enhancements to the data. There are many different techniques and methods of enhancing contrast and detail in an image; we will cover only a few common ones here. The simplest type of enhancement is a linear contrast stretch. This involves identifying lower and upper bounds from the histogram (usually the minimum and maximum brightness values in the image) and applying a transformation to stretch this range to fill the full range. In our example, the minimum value (occupied by actual data) in the histogram is 84 and the maximum value is 153. These 70 levels occupy less than one-third of the full 256 levels available. A linear stretch uniformly expands this small range to cover the full range of values from 0 to 255. This enhances the contrast in the image with light toned areas appearing lighter and dark areas appearing darker, making visual interpretation much easier. This graphic illustrates the increase in contrast in an image before (left) and after (right) a linear contrast stretch.

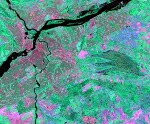
 A uniform distribution of the input range of values across the full range may not always be an appropriate enhancement, particularly if the input range is not uniformly distributed. In this case, a histogram-equalized stretch may be better. This stretch assigns more display values (range) to the frequently occurring portions of the histogram. In this way, the detail in these areas will be better enhanced relative to those areas of the original histogram where values occur less frequently. In other cases, it may be desirable to enhance the contrast in only a specific portion of the histogram. For example, suppose we have an image of the mouth of a river, and the water portions of the image occupy the digital values from 40 to 76 out of the entire image histogram. If we wished to enhance the detail in the water, perhaps to see variations in sediment load, we could stretch only that small portion of the histogram represented by the water (40 to 76) to the full grey level range (0 to 255). All pixels below or above these values would be assigned to 0 and 255, respectively, and the detail in these areas would be lost. However, the detail in the water would be greatly enhanced.
 Spatial filtering encompasses another set of digital processing functions which are used to enhance the appearance of an image. Spatial filters are designed to highlight or suppress specific features in an image based on their spatial frequency. Spatial frequency is related to the concept of image texture, which we discussed in section 4.2. It refers to the frequency of the variations in tone that appear in an image. "Rough" textured areas of an image, where the changes in tone are abrupt over a small area, have high spatial frequencies, while "smooth" areas with little variation in tone over several pixels, have low spatial frequencies. A common filtering procedure involves moving a 'window' of a few pixels in dimension (e.g. 3x3, 5x5, etc.) over each pixel in the image, applying a mathematical calculation using the pixel values under that window, and replacing the central pixel with the new value. The window is moved along in both the row and column dimensions one pixel at a time and the calculation is repeated until the entire image has been filtered and a "new" image has been generated. By varying the calculation performed and the weightings of the individual pixels in the filter window, filters can be designed to enhance or suppress different types of features.
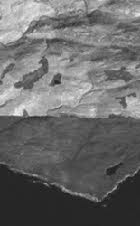
A low-pass filter is designed to emphasize larger, homogeneous areas of similar tone and reduce the smaller detail in an image. Thus, low-pass filters generally serve to smooth the appearance of an image. Average and median filters, often used for radar imagery (and described in Chapter 3), are examples of low-pass filters. High-pass filters do the opposite and serve to sharpen the appearance of fine detail in an image. One implementation of a high-pass filter first applies a low-pass filter to an image and then subtracts the result from the original, leaving behind only the high spatial frequency information. Directional, or edge detection filters are designed to highlight linear features, such as roads or field boundaries. These filters can also be designed to enhance features which are oriented in specific directions. These filters are useful in applications such as geology, for the detection of linear geologic structures.
![]()

![]()
| Updated2002-08-21 | Important Notices |