| Table of Contents |
| 1. Introduction 2. Sensors 3. Microwaves |
4. Image Analysis |
| 5. Applications |
Fundamentals of Remote Sensing
4.6 Image Transformations
Image transformations typically involve the manipulation of multiple bands of data, whether from a single multispectral image or from two or more images of the same area acquired at different times (i.e. multitemporal image data). Either way, image transformations generate "new" images from two or more sources which highlight particular features or properties of interest, better than the original input images.
 Basic image transformations apply simple arithmetic operations to the image data. Image subtraction is often used to identify changes that have occurred between images collected on different dates. Typically, two images which have been geometrically registered (see section 4.4), are used with the pixel (brightness) values in one image (1) being subtracted from the pixel values in the other (2). Scaling the resultant image (3) by adding a constant (127 in this case) to the output values will result in a suitable 'difference' image. In such an image, areas where there has been little or no change (A) between the original images, will have resultant brightness values around 127 (mid-grey tones), while those areas where significant change has occurred (B) will have values higher or lower than 127 - brighter or darker depending on the 'direction' of change in reflectance between the two images . This type of image transform can be useful for mapping changes in urban development around cities and for identifying areas where deforestation is occurring, as in this example.
Image division or spectral ratioing is one of the most common transforms applied to image data. Image ratioing serves to highlight subtle variations in the spectral responses of various surface covers. By ratioing the data from two different spectral bands, the resultant image enhances variations in the slopes of the spectral reflectance curves between the two different spectral ranges that may otherwise be masked by the pixel brightness variations in each of the bands. The following example illustrates the concept of spectral ratioing. Healthy vegetation reflects strongly in the near-infrared portion of the spectrum while absorbing strongly in the visible red. Other surface types, such as soil and water, show near equal reflectances in both the near-infrared and red portions. Thus, a ratio image of Landsat MSS Band 7 (Near-Infrared - 0.8 to 1.1 mm) divided by Band 5 (Red - 0.6 to 0.7 mm) would result in ratios much greater than 1.0 for vegetation, and ratios around 1.0 for soil and water. Thus the discrimination of vegetation from other surface cover types is significantly enhanced. Also, we may be better able to identify areas of unhealthy or stressed vegetation, which show low near-infrared reflectance, as the ratios would be lower than for healthy green vegetation.
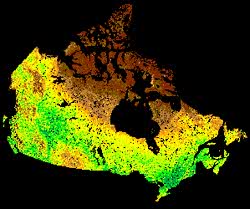
Another benefit of spectral ratioing is that, because we are looking at relative values (i.e. ratios) instead of absolute brightness values, variations in scene illumination as a result of topographic effects are reduced. Thus, although the absolute reflectances for forest covered slopes may vary depending on their orientation relative to the sun's illumination, the ratio of their reflectances between the two bands should always be very similar. More complex ratios involving the sums of and differences between spectral bands for various sensors, have been developed for monitoring vegetation conditions. One widely used image transform is the Normalized Difference Vegetation Index (NDVI) which has been used to monitor vegetation conditions on continental and global scales using the Advanced Very High Resolution Radiometer (AVHRR) sensor onboard the NOAA series of satellites (see Chapter 2, section 2.11).
 Different bands of multispectral data are often highly correlated and thus contain similar information. For example, Landsat MSS Bands 4 and 5 (green and red, respectively) typically have similar visual appearances since reflectances for the same surface cover types are almost equal. Image transformation techniques based on complex processing of the statistical characteristics of multi-band data sets can be used to reduce this data redundancy and correlation between bands. One such transform is called principal components analysis. The objective of this transformation is to reduce the dimensionality (i.e. the number of bands) in the data, and compress as much of the information in the original bands into fewer bands. The "new" bands that result from this statistical procedure are called components. This process attempts to maximize (statistically) the amount of information (or variance) from the original data into the least number of new components. As an example of the use of principal components analysis, a seven band Thematic Mapper (TM) data set may be transformed such that the first three principal components contain over 90 percent of the information in the original seven bands. Interpretation and analysis of these three bands of data, combining them either visually or digitally, is simpler and more efficient than trying to use all of the original seven bands. Principal components analysis, and other complex transforms, can be used either as an enhancement technique to improve visual interpretation or to reduce the number of bands to be used as input to digital classification procedures, discussed in the next section.
![]()
![]()
| Updated2002-08-21 | Important Notices |