
| Table of Contents |
| 1. Introduction 2. Sensors 3. Microwaves 4. Image Analysis 5. Applications |
Fundamentals of Remote Sensing
5.6.1 Did You Know?
"...I like my eggs on ice..."
Creating an Ice Chart
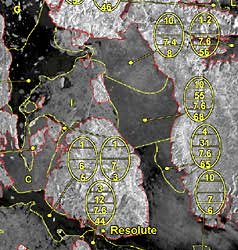
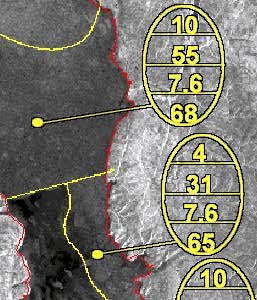 The Canadian Ice Service of Environment Canada (CISEC) creates charts for ice type that are distributed to their clients on a near-real time basis. These charts are essentially ice maps with Egg Codes superimposed, which explain the development stage (thickness), size, and concentration of ice at both regional and site specific scales. The codes used to represent the ice information are displayed in an oval symbol, resembling an egg, hence the term Egg Code . Egg codes are used not only for sea ice, but also lake ice. Also they conform to the WMO (World Meteorological Organization) standards.
Once you understand the meaning of the various codes, the interpretation of the ice charts is relatively easy.
For more detailed information about the coding procedure and terminology, go to the ![]() Canadian Ice Service homepage.
Canadian Ice Service homepage.
Case study (example)
RADARSAT Expedites Expedition to the Magnetic North Pole!
 In March of 1996, teams of Arctic adventurers set out on an expedition to reach the magnetic North Pole, located on the west coast of Ellef Ringnes Island, in Canada's high Arctic. Travelling across sea ice by ski, the teams required a route on smooth first year ice in order to haul their gear and conserve energy. Ice blocks, rubble and irregular relief made deformed and multi-year ice virtually impassable. One team relied on remote sensing - image maps created from RADARSAT data - to plan their route.
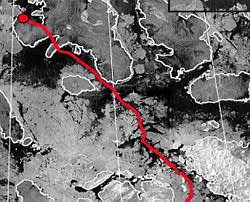
The ScanSAR image covered the entire extent of the route, from Resolute Bay on Cornwallis Island to the pole (78°6'N, 104°3'W). The resolution of 100m provided information about the ice cover and type, and mapped coastlines were added following geometric processing, to provide a geographic reference. The team was also equipped with GPS and communication technologies.
On the image map, passable ice appears uniformly dark, due to the specular reflection of incident radiation from the radar on the smooth surface. Rubbly, rough ice that often contained enough relief to make skiing impossible appears bright, due to the reflection of the radar energy back to the sensor.
The team using RADARSAT image maps was the only one to complete their journey to the magnetic North Pole. The other teams were hindered by rough ice and could not efficiently plan their route without the synoptic view provided by remote sensing. RADARSAT, with its sensitivity to ice type, far northern coverage, and reliable imaging was the most suitable sensor for this type of application. Its success bodes well for future exploration endeavors!
Reference: Lasserre, M., 1996. RADARSAT Image Maps Make Arctic Expedition a Success, Remote Sensing in Canada, Vol. 24, No. 1, June, 1996. Natural Resources Canada.
Expedition Web Site: ![]() http://www.jeaneudes.qc.ca/
http://www.jeaneudes.qc.ca/
![]()
![]()
| Updated2002-08-21 | Important Notices |