
| Table of Contents |
| 1. Introduction 2. Sensors 3. Microwaves 4. Image Analysis |
|
5. Applications |
Fundamentals of Remote Sensing
5.6.1 Ice type and concentration
Background
Ships navigating through high latitude seas (both northern and southern) are often faced with obstacles of pack ice and moving ice floes. Ice breakers are designed to facilitate travel in these areas, but they require knowledge about the most efficient and effective route through the ice. It is important to know the extent of the ice, what type of ice it is, and the concentration and distribution of each type. This information is also valuable for offshore exploration and construction activities, as well as coastal development planning.
Ice isn't simply ice!
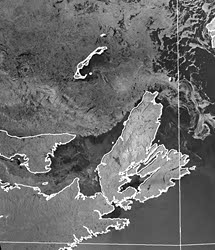
Sea ice isn't a uniform, homogeneous unit. What appears to be a single cover of ice can vary in roughness, strength, salinity, and thickness. Pack ice and ice floes consist of assemblages of different ice types patchworked together, intersected by dynamic leads or cracks. Ice is usually defined by its age - either as new, first-year or multi-year ice. New ice is smooth and relatively thin (5-30 cm)and provides the least resistance to ice breakers . First year ice is older and thicker than new ice (30-200cm) and can pose a significant hazard to all vessels, including icebreakers. When deformed into rubble fields and ridges, first year ice types can become impassable. Ice that survives into a second and later years, generally becomes thicker (>2m) and declines in salinity, increasing the internal strength. This ice is a dangerous hazard to ships and off-shore structures. Ice charts are maps of different ice types and concentration of ice, which are distributed to those working in marine environments where ice affects their operations.
Why remote sensing?
Observing ice conditions is best from a ground perspective, but this doesn't allow for determining the extent or distribution of the ice. Remote sensing from airborne or spaceborne sensors provides this very valuable view. The areas of ice can be easily mapped from an image, and when georeferenced, provide a useful information source. Remote sensing technology is capable of providing enough information for an analyst to identify ice type (and thus infer ice thickness), and from this data, ice charts can be created and distributed to those who require the information.
Active radar is an excellent sensor to observe ice conditions because the microwave energy and imaging geometry combines to provide measures of both surface and internal characteristics. Backscatter is influenced by dielectric properties of the ice (in turn dependent on salinity and temperature), surface factors (roughness, snow cover) and internal geometry / microstructure. Surface texture is the main contributor to the radar backscatter and it is this characteristic which is used to infer ice age and thickness. New ice tends to have a low return and therefore dark appearance on the imagery due to the specular reflection of incident energy off the smooth surface. First year ice can have a wide variety of brightness depending on the degree of roughness caused by ridging and rubbing. Multi-year ice has a bright return due to diffuse scattering from its low salinity, and porous structure.
Coarse resolution optical sensors such as NOAA's AVHRR provide an excellent overview of pack ice extent if atmospheric conditions are optimal (resolution = 1km).
Passive microwave sensing also has a role in sea ice applications. Objects (including people!) emit small amounts of microwave radiation, which can be detected by sensors. Sea ice and water emit substantially different amounts of radiation, so it is relatively easy to delineate the interface between the two. The SSM/I onboard the shuttle collected data in this manner. The main drawback of passive microwave sensors is their poor spatial resolution (approx. 25km) which is too coarse for tactical ice navigation.
Data requirements
Ocean ice occurs in extreme latitudes - the high Arctic and Antarctica. But ice also covers prime sea and lake shipping routes in northern countries, particularly Canada, Russia, Japan and northern European and Scandinavian countries. High latitude areas experience low solar illumination conditions in the winter when the ice is at a maximum. This has traditionally hindered remote sensing effectiveness, until the operationalization of radar sensors. The all weather / day - night, capabilities of SAR systems, makes radar remote sensing the most useful for ice type and concentration mapping.
To provide sufficient information for navigation purposes, the data must be captured frequently and must be processed and ready for use within a very short time frame. High resolution data covering 1-50 km is useful for immediate ship navigation, whereas coarse resolution (1-50km), large area coverage (100 - 2000km²) images are more useful for regional strategic route planning. For navigation purposes, the value of this information has a limited time window. However, for playing a role in increasing our knowledge about climate dynamics and ice as an indicator of global climate change, the data has long term value.
RADARSAT has orbital parameters and a radar sensor designed to address the demands of the ice applications community. The Arctic area is covered once a day by RADARSAT and systems are in place to efficiently download the data direct from the ground processing station right to the vessel requiring the information, in a time frame of four hours. Airborne radar sensors are also useful for targeting specific areas and providing high resolution imagery unavailable from commercial spaceborne systems. Airborne radar is more expensive but has the benefit of directly targetting the area of interest, which may be important for time critical information, such as tactical navigation in dynamic ice. Winter is the preferred season for acquiring radar scenes for ice typing. Melting and wet conditions reduce the contrast between ice types which makes information extraction more difficult.
Future remote sensing devices are planned to provide comprehensive measurements of sea ice extent.
![]()

![]()
| Updated2002-08-21 | Important Notices |