Fundamentals of Remote Sensing
2.12 Land Observation Satellites/Sensors
Landsat
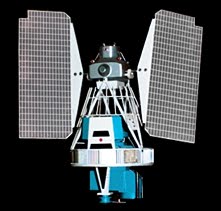 Although many of the weather satellite systems (such as those described in the previous section) are also used for monitoring the Earth's surface, they are not optimized for detailed mapping of the land surface. Driven by the exciting views from, and great success of the early meteorological satellites in the 1960's, as well as from images taken during manned spacecraft missions, the first satellite designed specifically to monitor the Earth's surface, Landsat-1, was launched by NASA in 1972. Initially referred to as ERTS-1, (Earth Resources Technology Satellite), Landsat was designed as an experiment to test the feasibility of collecting multi-spectral Earth observation data from an unmanned satellite platform. Since that time, this highly successful program has collected an abundance of data from around the world from several Landsat satellites. Originally managed by NASA, responsibility for the Landsat program was transferred to NOAA in 1983. In 1985, the program became commercialized, providing data to civilian and applications users.
Landsat's success is due to several factors, including: a combination of sensors with spectral bands tailored to Earth observation; functional spatial resolution; and good areal coverage (swath width and revisit period). The long lifespan of the program has provided a voluminous archive of Earth resource data facilitating long term monitoring and historical records and research. All Landsat satellites are placed in near-polar, sun-synchronous orbits. The first three satellites (Landsats 1-3) are at altitudes around 900 km and have revisit periods of 18 days while the later satellites are at around 700 km and have revisit periods of 16 days. All Landsat satellites have equator crossing times in the morning to optimize illumination conditions.
A number of sensors have been on board the Landsat series of satellites, including the Return Beam Vidicon (RBV) camera systems, the MultiSpectral Scanner (MSS) systems, and the Thematic Mapper (TM). The most popular instrument in the early days of Landsat was the MultiSpectral Scanner (MSS) and later the Thematic Mapper (TM). Each of these sensors collected data over a swath width of 185 km, with a full scene being defined as 185 km x 185 km.
The MSS senses the electromagnetic radiation from the Earth's surface in four spectral bands. Each band has a spatial resolution of approximately 60 x 80 metres and a radiometric resolution of 6 bits, or 64 digital numbers. Sensing is accomplished with a line scanning device using an oscillating mirror. Six scan lines are collected simultaneously with each west-to-east sweep of the scanning mirror. The accompanying table outlines the spectral wavelength ranges for the MSS.
MSS Bands
| Channel | Wavelength Range (mm) | |
|---|---|---|
| Landsat 1,2,3 | Landsat 4,5 | |
| MSS 4 | MSS 1 | 0.5 - 0.6 (green) |
| MSS 5 | MSS 2 | 0.6 - 0.7 (red) |
| MSS 6 | MSS 3 | 0.7 - 0.8 (near infrared) |
| MSS 7 | MSS 4 | 0.8 - 1.1 (near infrared) |
Routine collection of MSS data ceased in 1992, as the use of TM data, starting on Landsat 4, superseded the MSS. The TM sensor provides several improvements over the MSS sensor including: higher spatial and radiometric resolution; finer spectral bands; seven as opposed to four spectral bands; and an increase in the number of detectors per band (16 for the non-thermal channels versus six for MSS). Sixteen scan lines are captured simultaneously for each non-thermal spectral band (four for thermal band), using an oscillating mirror which scans during both the forward (west-to-east) and reverse (east-to-west) sweeps of the scanning mirror. This difference from the MSS increases the dwell time (see section 2.8) and improves the geometric and radiometric integrity of the data. Spatial resolution of TM is 30 m for all but the thermal infrared band which is 120 m. All channels are recorded over a range of 256 digital numbers (8 bits). The accompanying table outlines the spectral resolution of the individual TM bands and some useful applications of each.
TM Bands
| Channel | Wavelength Range (mm) | Application |
|---|---|---|
| TM 1 | 0.45 - 0.52 (blue) | soil/vegetation discrimination; bathymetry/coastal mapping; cultural/urban feature identification |
| TM 2 | 0.52 - 0.60 (green) | green vegetation mapping (measures reflectance peak); cultural/urban feature identification |
| TM 3 | 0.63 - 0.69 (red) | vegetated vs. non-vegetated and plant species discrimination (plant chlorophyll absorption); cultural/urban feature identification |
| TM 4 | 0.76 - 0.90 (near IR) | identification of plant/vegetation types, health, and biomass content; water body delineation; soil moisture |
| TM 5 | 1.55 - 1.75 (short wave IR) | sensitive to moisture in soil and vegetation; discriminating snow and cloud-covered areas |
| TM 6 | 10.4 - 12.5 (thermal IR) | vegetation stress and soil moisture discrimination related to thermal radiation; thermal mapping (urban, water) |
| TM 7 | 2.08 - 2.35 (short wave IR) | discrimination of mineral and rock types; sensitive to vegetation moisture content |
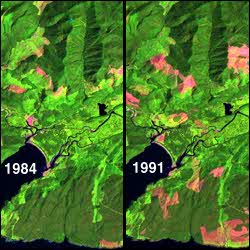 Data from both the TM and MSS sensors are used for a wide variety of applications, including resource management, mapping, environmental monitoring, and change detection (e.g. monitoring forest clearcutting). The archives of Canadian imagery include over 350,000 scenes of MSS and over 200,000 scenes of TM, managed by the licensed distributor in Canada: RSI Inc. Many more scenes are held by foreign facilities around the world.
SPOT
 SPOT (Système Pour l'Observation de la Terre) is a series of Earth observation imaging satellites designed and launched by CNES (Centre National d'Études Spatiales) of France, with support from Sweden and Belgium. SPOT-1 was launched in 1986, with successors following every three or four years. All satellites are in sun-synchronous, near-polar orbits at altitudes around 830 km above the Earth, which results in orbit repetition every 26 days. They have equator crossing times around 10:30 AM local solar time. SPOT was designed to be a commercial provider of Earth observation data, and was the first satellite to use along-track, or pushbroom scanning technology.
The SPOT satellites each have twin high resolution visible (HRV) imaging systems, which can be operated independently and simultaneously. Each HRV is capable of sensing either in a high spatial resolution single-channel panchromatic (PLA) mode, or a coarser spatial resolution three-channel multispectral (MLA) mode. Each along-track scanning HRV sensor consists of four linear arrays of detectors: one 6000 element array for the panchromatic mode recording at a spatial resolution of 10 m, and one 3000 element array for each of the three multispectral bands, recording at 20 m spatial resolution. The swath width for both modes is 60 km at nadir. The accompanying table illustrates the spectral characteristics of the two different modes.
HRV Mode Spectral Ranges
| Mode/Band | Wavelength Range (mm) |
|---|---|
| Panchromatic (PLA) | 0.51 - 0.73 (blue-green-red) |
| Multispectral (MLA) | |
| Band 1 | 0.50 - 0.59 (green) |
| Band 2 | 0.61 - 0.68 (red) |
| Band 3 | 0.79 - 0.89 (near infrared) |
 The viewing angle of the sensors can be adjusted to look to either side of the satellite's vertical (nadir) track, allowing off-nadir viewing which increases the satellite's revisit capability. This ability to point the sensors up to 27° from nadir, allows SPOT to view within a 950 km swath and to revisit any location several times per week. As the sensors point away from nadir, the swath varies from 60 to 80 km in width. This not only improves the ability to monitor specific locations and increases the chances of obtaining cloud free scenes, but the off-nadir viewing also provides the capability of acquiring imagery for stereoscopic coverage. By recording the same area from two different angles, the imagery can be viewed and analyzed as a three dimensional model, a technique of tremendous value for terrain interpretation, mapping, and visual terrain simulations.
 This oblique viewing capability increases the revisit frequency of equatorial regions to three days (seven times during the 26 day orbital cycle). Areas at a latitude of 45º can be imaged more frequently (11 times in 26 days) due to the convergence or orbit paths towards the poles. By pointing both HRV sensors to cover adjacent ground swaths at nadir, a swath of 117 km (3 km overlap between the two swaths) can be imaged. In this mode of operation, either panchromatic or multispectral data can be collected, but not both simultaneously.
 SPOT has a number of benefits over other spaceborne optical sensors. Its fine spatial resolution and pointable sensors are the primary reasons for its popularity. The three-band multispectral data are well suited to displaying as false-colour images and the panchromatic band can also be used to "sharpen" the spatial detail in the multispectral data. SPOT allows applications requiring fine spatial detail (such as urban mapping) to be addressed while retaining the cost and timeliness advantage of satellite data. The potential applications of SPOT data are numerous. Applications requiring frequent monitoring (agriculture, forestry) are well served by the SPOT sensors. The acquisition of stereoscopic imagery from SPOT has played an important role in mapping applications and in the derivation of topographic information (Digital Elevation Models - DEMs) from satellite data.
IRS
The Indian Remote Sensing (IRS) satellite series, combines features from both the Landsat MSS/TM sensors and the SPOT HRV sensor. The third satellite in the series, IRS-1C, launched in December, 1995 has three sensors: a single-channel panchromatic (PAN) high resolution camera, a medium resolution four-channel Linear Imaging Self-scanning Sensor (LISS-III), and a coarse resolution two-channel Wide Field Sensor (WiFS). The accompanying table outlines the specific characteristics of each sensor.
IRS Sensors
| Sensor | Wavelength Range (mm) | Spatial Resolution | Swath Width | Revisit Period (at equator) |
|---|---|---|---|---|
| PAN | 0.5 - 0.75 | 5.8 m | 70 km | 24 days |
| LISS-II | ||||
| Green | 0.52 - 0.59 | 23 m | 142 km | 24 days |
| Red | 0.62 - 0.68 | 23 m | 142 km | 24 days |
| Near IR | 0.77 - 0.86 | 23 m | 142 km | 24 days |
| Shortwave IR | 1.55 - 1.70 | 70 m | 148 km | 24 days |
| WiFS | ||||
| Red | 0.62 - 0.68 | 188 m | 774 km | 5 days |
| Near IR | 0.77 - 0.86 | 188 m | 774 km | 5 days |
In addition to its high spatial resolution, the panchromatic sensor can be steered up to 26° across-track, enabling stereoscopic imaging and increased revisit capablilities (as few as five days), similar to SPOT. This high resolution data is useful for urban planning and mapping applications. The four LISS-III multispectral bands are similar to Landsat's TM bands 1 to 4 and are excellent for vegetation discrimination, land-cover mapping, and natural resource planning. The WiFS sensor is similar to NOAA AVHRR bands and the spatial resolution and coverage is useful for regional scale vegetation monitoring.
MEIS-II and CASI
Although this tutorial concentrates on satellite-borne sensors, it is worth mentioning a couple of Canadian airborne sensors which have been used for various remote sensing applications, as these systems (and others like them) have influenced the design and development of satellite systems. The first is the MEIS-II (Multispectral Electro-optical Imaging Scanner) sensor developed for the Canada Centre for Remote Sensing. Although no longer active, MEIS was the first operational use of pushbroom, or along-track scanning technology in an airborne platform. The sensor collected 8-bit data (256 digital numbers) in eight spectral bands ranging from 0.39 to 1.1 mm, using linear arrays of 1728 detectors per band. The specific wavelength ranges were selectable, allowing different band combinations to be used for different applications. Stereo imaging from a single flight line was also possible, with channels aimed ahead of and behind nadir, supplementing the other nadir facing sensors. Both the stereo mapping and the selectable band capabilities were useful in research and development which was applied to development of other satellite (and airborne) sensor systems.
CASI, the Compact Airborne Spectrographic Imager, is a leader in airborne imaging, being the first commercial imaging spectrometer. This hyperspectral sensor detects a vast array of narrow spectral bands in the visible and infrared wavelengths, using along-track scanning. The spectral range covered by the 288 channels is between 0.4 and 0.9 mm. Each band covers a wavelength range of 0.018 mm. While spatial resolution depends on the altitude of the aircraft, the spectral bands measured and the bandwidths used are all programmable to meet the user's specifications and requirements. Hyperspectral sensors such as this can be important sources of diagnostic information about specific targets' absorption and reflection characteristics, in effect providing a spectral 'fingerprint'. Experimentation with CASI and other airborne imaging spectrometers has helped guide the development of hyperspectral sensor systems for advanced satellite systems.
![]()


![]()
| Updated2002-08-21 | Important Notices |