
| Table of Contents |
| 1. Introduction 2. Sensors |
3. Microwaves |
| 4. Image Analysis 5. Applications |
Fundamentals of Remote Sensing
3.6 Radar Image Properties
All radar images appear with some degree of what we call radar speckle. Speckle appears as a grainy "salt and pepper" texture in an image. This is caused by random constructive and destructive interference from the multiple scattering returns that will occur within each resolution cell. As an example, an homogeneous target, such as a large grass-covered field, without the effects of speckle would generally result in light-toned pixel values on an image (A). However, reflections from the individual blades of grass within each resolution cell results in some image pixels being brighter and some being darker than the average tone (B), such that the field appears speckled.
Speckle is essentially a form of noise which degrades the quality of an image and may make interpretation (visual or digital) more difficult. Thus, it is generally desirable to reduce speckle prior to interpretation and analysis. Speckle reduction can be achieved in two ways:
- multi-look processing, or
- spatial filtering.
 Multi-look processing refers to the division of the radar beam (A) into several (in this example, five) narrower sub-beams (1 to 5). Each sub-beam provides an independent "look" at the illuminated scene, as the name suggests. Each of these "looks" will also be subject to speckle, but by summing and averaging them together to form the final output image, the amount of speckle will be reduced.
 While multi-looking is usually done during data acquisition, speckle reduction by spatial filtering is performed on the output image in a digital (i.e. computer) image analysis environment. Speckle reduction filtering consists of moving a small window of a few pixels in dimension (e.g. 3x3 or 5x5) over each pixel in the image, applying a mathematical calculation using the pixel values under that window (e.g. calculating the average), and replacing the central pixel with the new value. The window is moved along in both the row and column dimensions one pixel at a time, until the entire image has been covered. By calculating the average of a small window around each pixel, a smoothing effect is achieved and the visual appearance of the speckle is reduced.

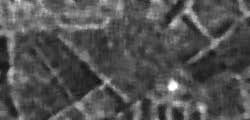
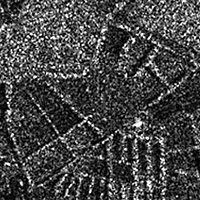
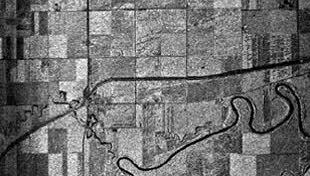
Speckle reduction using an averaging filter
This graphic shows a radar image before (top) and after (bottom) speckle reduction using an averaging filter. The median (or middle) value of all the pixels underneath the moving window is also often used to reduce speckle. Other more complex filtering calculations can be performed to reduce speckle while minimizing the amount of smoothing taking place.
Both multi-look processing and spatial filtering reduce speckle at the expense of resolution, since they both essentially smooth the image. Therefore, the amount of speckle reduction desired must be balanced with the particular application the image is being used for, and the amount of detail required. If fine detail and high resolution is required then little or no multi-looking/spatial filtering should be done. If broad-scale interpretation and mapping is the application, then speckle reduction techniques may be more appropriate and acceptable.
Another property peculiar to radar images is slant-range distortion, which was discussed in some detail in section 3.4. Features in the near-range are compressed relative to features in the far range due to the slant-range scale variability. For most applications, it is desirable to have the radar image presented in a format which corrects for this distortion, to enable true distance measurements between features. This requires the slant-range image to be converted to 'ground range' display. This can be done by the radar processor prior to creating an image or after data acquisition by applying a transformation to the slant range image. In most cases, this conversion will only be an estimate of the geometry of the ground features due to the complications introduced by variations in terrain relief and topography.
A radar antenna transmits more power in the mid-range portion of the illuminated swath than at the near and far ranges. This effect is known as antenna pattern and results in stronger returns from the center portion of the swath than at the edges. Combined with this antenna pattern effect is the fact that the energy returned to the radar decreases dramatically as the range distance increases. Thus, for a given surface, the strength of the returned signal becomes smaller and smaller moving farther across the swath. These effects combine to produce an image which varies in intensity (tone) in the range direction across the image. A process known as antenna pattern correction may be applied to produce a uniform average brightness across the imaged swath, to better facilitate visual interpretation.
The range of brightness levels a remote sensing system can differentiate is related to radiometric resolution (section 2.5) and is referred to as the dynamic range. While optical sensors, such as those carried by satellites such as Landsat and SPOT, typically produce 256 intensity levels, radar systems can differentiate intensity levels up to around 100,000 levels! Since the human eye can only discriminate about 40 intensity levels at one time, this is too much information for visual interpretation. Even a typical computer would have difficulty dealing with this range of information. Therefore, most radars record and process the original data as 16 bits (65,536 levels of intensity), which are then further scaled down to 8 bits (256 levels) for visual interpretation and/or digital computer analysis.
Calibration is a process which ensures that the radar system and the signals that it measures are as consistent and as accurate as possible. Prior to analysis, most radar images will require relative calibration. Relative calibration corrects for known variations in radar antenna and systems response and ensures that uniform, repeatable measurements can be made over time. This allows relative comparisons between the response of features within a single image, and between separate images to be made with confidence. However, if we wish to make accurate quantitative measurements representing the actual energy or power returned from various features or targets for comparative purposes, then absolute calibration is necessary.
Absolute calibration, a much more involved process than relative calibration, attempts to relate the magnitude of the recorded signal strength to the actual amount of energy backscattered from each resolution cell. To achieve this, detailed measurements of the radar system properties are required as well as quantitative measurements of the scattering properties of specific targets. The latter are often obtained using ground-based scatterometers, as described in section 3.1. Also, devices called transponders may be placed on the ground prior to data acquisition to calibrate an image. These devices receive the incoming radar signal, amplify it, and transmit a return signal of known strength back to the radar. By knowing the actual strength of this return signal in the image, the responses from other features can be referenced to it.
![]()

![]()
| Updated 2002-11-27 | Important Notices |