| Table of Contents |
| 1. Introduction 2. Sensors 3. Microwaves 4. Image Analysis |
|
5. Applications |
Fundamentals of Remote Sensing
5.7.2 Land Cover / Biomass Mapping
Background
Land cover mapping serves as a basic inventory of land resources for all levels of government, environmental agencies, and private industry throughout the world. Whether regional or local in scope, remote sensing offers a means of acquiring and presenting land cover data in a timely manner. Land cover includes everything from crop type, ice and snow, to major biomes including tundra, boreal or rainforest, and barren land.
Regional land cover mapping is performed by almost anyone who is interested in obtaining an inventory of land resources, to be used as a baseline map for future monitoring and land management. Programs are conducted around the world to observe regional crop conditions as well as investigating climatic change on a regional level through biome monitoring. Biomass mapping provides quantifiable estimates of vegetation cover, and biophysical information such as leaf area index (LAI), net primary productivity (NPP) and total biomass accumulations (TBA) measurements - important parameters for measuring the health of our forests, for example.
Why remote sensing?
 There is nothing as practical and cost efficient for obtaining a timely regional overview of land cover than remote sensing techniques. Remote sensing data are capable of capturing changes in plant phenology (growth) throughout the growing season, whether relating to changes in chlorophyll content (detectable with VIR) or structural changes (via radar). For regional mapping, continuous spatial coverage over large areas is required. It would be difficult to detect regional trends with point source data. Remote sensing fulfills this requirement, as well as providing multispectral, multisource, and multitemporal information for an accurate classification of land cover. The multisource example image shows the benefit of increased information content when two data sources are integrated. On the left is TM data, and on the right it has been merged with airborne SAR.

Data requirements
For continental and global scale vegetation studies, moderate resolution data (1km) is appropriate, since it requires less storage space and processing effort, a significant consideration when dealing with very large area projects. Of course the requirements depend entirely on the scope of the application. Wetland mapping for instance, demands a critical acquisition period and a high resolution requirement.
Coverage demand will be very large for regional types of surveying. One way to adequately cover a large area and retain high resolution, is to create mosaics of the area from a number of scenes.
Land cover information may be time sensitive. The identification of crops, for instance canola, may require imaging on specific days of flowering, and therefore, reliable imaging is appropriate. Multi-temporal data are preferred for capturing changes in phenology throughout the growing season. This information may be used in the classification process to more accurately discriminate vegetation types based on their growing characteristics.

While optical data are best for land cover mapping, radar imagery is a good replacement in very cloudy areas.
Case study (example)
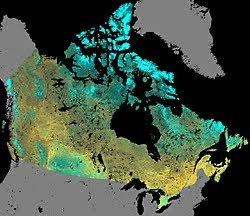
NBIOME: Classification of Canada's Land Cover
 A major initiative of the Canada Centre for Remote Sensing is the development of an objective, reproducible classification of Canada's landcover. This classification methodology is used to produce a baseline map of the major biomes and land cover in Canada, which can then be compared against subsequent classifications to observe changes in cover. These changes may relate to regional climatic or anthropogenic changes affecting the landscape.
The classification is based on NOAA-AVHRR LAC (Local Area Coverage) (1km) data. The coarse resolution is required to ensure efficient processing and storage of the data, when dealing with such a large coverage area. Before the classification procedure, cloud -cover reduced composites of the Canadian landmass, each spanning 10 day periods are created. In the composite, the value for each pixel used is the one most cloud free of the ten days. This is determined by the highest normalized difference vegetation index (NDVI) value, since low NDVI is indicative of cloud cover (low infrared reflectance, high visible reflectance). The data also underwent a procedure to minimize atmospheric, bidirectional, and contamination effects.
The composites consist of four channels, mean reflectance of AVHRR channels 1 and 2, NDVI and area under the (temporal NDVI) curve. 16 composites (in 1993) were included in a customized land cover classification procedure (named: classification by progressive generalization), which is neither a supervised nor unsupervised methodology, but incorporates aspects of both. The classification approach is based on finding dominant spectral clusters and conducting progressive merging methodology. Eventually the clusters are labelled with the appropriate land cover classes. The benefit is that the classification is more objective than a supervised approach, while not controlling the parameters of clustering, which could alter the results.
The result of this work is an objective, reproducible classification of Canada's land cover.
| Updated2002-08-21 | Important Notices |