
| Table of Contents |
| 1. Introduction 2. Sensors 3. Microwaves 4. Image Analysis |
|
5. Applications |
Fundamentals of Remote Sensing
5.3.3 Burn Mapping
Background
Fire is part of the natural reproductive cycle of many forests revitalizing growth by opening seeds and releasing nutrients from the soil. However, fires can also spread quickly and threaten settlements and wildlife, eliminate timber supplies, and temporarily damage conservation areas. Information is needed to help control the extent of fire, and to assess how well the forest is recovering following a burn.
Why remote sensing?
Remote sensing can be used to detect and monitor forest fires and the regrowth following a fire. As a surveillance tool, routine sensing facilitates observing remote and inaccessible areas, alerting monitoring agencies to the presence and extent of a fire. NOAA AVHRR thermal data and GOES meteorological data can be used to delineate active fires and remaining "hot-spots" when optical sensors are hindered by smoke, haze, and /or darkness. Comparing burned areas to active fire areas provides information as to the rate and direction of movement of the fire. Remote sensing data can also facilitate route planning for both access to, and escape from, a fire, and supports logistics planning for fire fighting and identifying areas not successfully recovering following a burn.
Years following a fire, updates on the health and regenerative status of an area can be obtained by a single image, and multitemporal scenes can illustrate the progression of vegetation from pioneer species back to a full forest cover.
Data requirements
While thermal data is best for detecting and mapping ongoing fires, multispectral (optical and near-infrared) data are preferred for observing stages of growth and phenology in a previous burn area. The relative ages and area extent of burned areas can be defined and delineated, and health of the successive vegetation assessed and monitored. Moderate spatial coverage, high to moderate resolution, and a low turnaround time are required for burn mapping. On the other hand, fire detection and monitoring requires a large spatial coverage, moderate resolution and a very quick turnaround to facilitate response.
Canadian vs. International
Requirements for burn mapping are the same, except where cloud cover precludes the used of optical images. In this case, radar can be used to monitor previous burn areas, and is effective from the second year following a burn, onwards.
Case study (example) Northwest Territory Burn
Burned and burning forest near Norman Wells, NWT
In the western Northwest Territories along the Mackenzie River, boreal forest covers much of the landscape. Natives rely on the forests for hunting and trapping grounds, and the sensitive northern soil and permafrost are protected from erosion by the forest cover. In the early 1990's a huge fire devastated the region immediately east of the Mackenzie and threatened the town of Fort Norman, a native town south of Norman Wells.
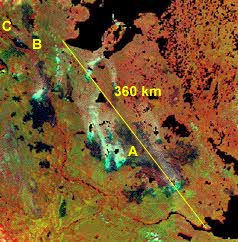
The extent of the burned area, and the areas still burning, can be identified on this NOAA scene, as dark regions (A). The lake in the upper right is Great Bear Lake, and the lake to the lower right is Great Slave Lake. The distance represented by the yellow line is approximately 580 km. The course of the Mackenzie River can be seen to the left of these lakes. Fort Norman (B) is located at the junction of the Mackenzie River and Great Bear River, leading out of Great Bear Lake. At that location, the fire is on both sides of the river. Norman Wells (C) is known as an oil producing area, and storage silos, oil rigs, homes, and the only commercial airport in that part of the country were threatened. Fires in this region are difficult to access because of the lack of roads into the region. Winter roads provide only seasonal access to vehicles in this part of Canada. The small population base also makes it difficult to control, let alone fight, a fire of this magnitude.
Haze and smoke reflect a large amount of energy at shorter wavelengths and appear as blue on this image.
![]()
![]()
| Updated2002-08-21 | Important Notices |