
| Table of Contents |
| 1. Introduction 2. Sensors 3. Microwaves 4. Image Analysis |
|
5. Applications |
Fundamentals of Remote Sensing
5.2.2 Crop Monitoring & Damage Assessment
Background
Assessment of the health of a crop, as well as early detection of crop infestations, is critical in ensuring good agricultural productivity. Stress associated with, for example, moisture deficiencies, insects, fungal and weed infestations, must be detected early enough to provide an opportunity for the farmer to mitigate. This process requires that remote sensing imagery be provided on a frequent basis (at a minimum, weekly) and be delivered to the farmer quickly, usually within 2 days.
Also, crops do not generally grow evenly across the field and consequently crop yield can vary greatly from one spot in the field to another. These growth differences may be a result of soil nutrient deficiencies or other forms of stress. Remote sensing allows the farmer to identify areas within a field which are experiencing difficulties, so that he can apply, for instance, the correct type and amount of fertilizer, pesticide or herbicide. Using this approach, the farmer not only improves the productivity from his land, but also reduces his farm input costs and minimizes environmental impacts.
There are many people involved in the trading, pricing, and selling of crops that never actually set foot in a field. They need information regarding crop health worldwide to set prices and to negotiate trade agreements. Many of these people rely on products such as a crop assessment index to compare growth rates and productivity between years and to see how well each country's agricultural industry is producing. This type of information can also help target locations of future problems, for instance the famine in Ethiopia in the late 1980's, caused by a significant drought which destroyed many crops. Identifying such areas facilitates in planning and directing humanitarian aid and relief efforts.
Why remote sensing?
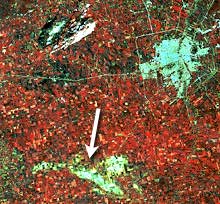 Remote sensing has a number of attributes that lend themselves to monitoring the health of crops. One advantage of optical (VIR) sensing is that it can see beyond the visible wavelengths into the infrared, where wavelengths are highly sensitive to crop vigour as well as crop stress and crop damage. Remote sensing imagery also gives the required spatial overview of the land. Recent advances in communication and technology allow a farmer to observe images of his fields and make timely decisions about managing the crops. Remote sensing can aid in identifying crops affected by conditions that are too dry or wet, affected by insect, weed or fungal infestations or weather related damage. Images can be obtained throughout the growing season to not only detect problems, but also to monitor the success of the treatment. In the example image given here, a tornado has destroyed/damaged crops southwest of Winnipeg, Manitoba.
 Healthy vegetation contains large quantities of chlorophyll, the substance that gives most vegetation its distinctive green colour. In referring to healthy crops, reflectance in the blue and red parts of the spectrum is low since chlorophyll absorbs this energy. In contrast, reflectance in the green and near-infrared spectral regions is high. Stressed or damaged crops experience a decrease in chlorophyll content and changes to the internal leaf structure. The reduction in chlorophyll content results in a decrease in reflectance in the green region and internal leaf damage results in a decrease in near-infrared reflectance. These reductions in green and infrared reflectance provide early detection of crop stress. Examining the ratio of reflected infrared to red wavelengths is an excellent measure of vegetation health.
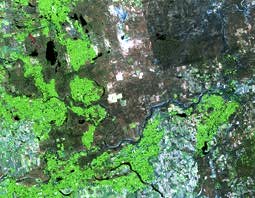
 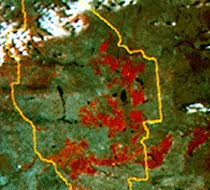 This is the premise behind some vegetation indices, such as the normalized differential vegetation index (NDVI) (Chapter 4). Healthy plants have a high NDVI value because of their high reflectance of infrared light, and relatively low reflectance of red light. Phenology and vigour are the main factors in affecting NDVI. An excellent example is the difference between irrigated crops and non-irrigated land. The irrigated crops appear bright green in a real-colour simulated image. The darker areas are dry rangeland with minimal vegetation. In a CIR (colour infrared simulated) image, where infrared reflectance is displayed in red, the healthy vegetation appears bright red, while the rangeland remains quite low in reflectance.
Examining variations in crop growth within one field is possible. Areas of consistently healthy and vigorous crop would appear uniformly bright. Stressed vegetation would appear dark amongst the brighter, healthier crop areas. If the data is georeferenced, and if the farmer has a GPS (global position satellite) unit, he can find the exact area of the problem very quickly, by matching the coordinates of his location to that on the image.
Data requirements
Detecting damage and monitoring crop health requires high-resolution imagery and multispectral imaging capabilities. One of the most critical factors in making imagery useful to farmers is a quick turnaround time from data acquisition to distribution of crop information. Receiving an image that reflects crop conditions of two weeks earlier does not help real time management nor damage mitigation. Images are also required at specific times during the growing season, and on a frequent basis.
Remote sensing doesn't replace the field work performed by farmers to monitor their fields, but it does direct them to the areas in need of immediate attention.
Canada vs. International
Efficient agricultural practices are a global concern, and other countries share many of the same requirements as Canada in terms of monitoring crop health by means of remote sensing. In many cases however, the scale of interest is smaller - smaller fields in Europe and Asia dictate higher resolution systems and smaller areal coverage. Canada, the USA, and Russia, amongst others, have more expansive areas devoted to agriculture, and have developed, or are in the process of developing crop information systems (see below). In this situation, regional coverage and lower resolution data (say: 1km) can be used. The lower resolution facilitates computer efficiency by minimizing storage space, processing efforts and memory requirements.
As an example of an international crop monitoring application, date palms are the prospective subject of an investigation to determine if remote sensing methods can detect damage from the red palm weevil in the Middle East. In the Arabian Peninsula, dates are extremely popular and date crops are one of the region's most important agricultural products. Infestation by the weevil could quickly devastate the palm crops and swallow a commodity worth hundreds of millions of dollars. Remote sensing techniques will be used to examine the health of the date crops through spectral analysis of the vegetation. Infested areas appear yellow to the naked eye, and will show a smaller near infrared reflectance and a higher red reflectance on the remotely sensed image data than the healthy crop areas. Authorities are hoping to identify areas of infestation and provide measures to eradicate the weevil and save the remaining healthy crops.
Case study (example)
Canadian Crop Information System: A composite crop index map is created each week, derived from composited NOAA-AVHRR data. Based on the NDVI, the index shows the health of crops in the prairie regions of Manitoba through to Alberta. These indices are produced weekly, and can be compared with indices of past years to compare crop growth and health.
In 1988, severe drought conditions were prevalent across the prairies. Using NDVI values from NOAA AVHRR data, a drought area analysis determined the status of drought effects on crops across the affected area. Red and yellow areas indicate those crops in a weakened and stressed state, while green indicates healthy crop conditions. Note that most of the healthy crops are those in the cooler locations, such as in the northern Alberta (Peace River) and the higher elevations (western Alberta). Non-cropland areas (dry rangeland and forested land) are indicated in black, within the analysis region.
![]()
![]()
| Updated2002-08-21 | Important Notices |