| Table of Contents |
| 1. Introduction 2. Sensors 3. Microwaves 4. Image Analysis |
|
5. Applications |
Fundamentals of Remote Sensing
5.9.3 Oil Spill Detection
Background
Oil spills can destroy marine life as well as damage habitat for land animals and humans. The majority of marine oilspills result from ships emptying their billage tanks before or after entering port. Large area oilspills result from tanker ruptures or collisions with reefs, rocky shoals, or other ships. These spills are usually spectacular in the extent of their environmental damage and generate wide spread media coverage. Routine surveillance of shipping routes and coastal areas is necessary to enforce maritime pollution laws and identify offenders.
Following a spill, the shipping operator or oil company involved is responsible for setting up emergency evaluation and response teams, and employing remediating measures to minimize the extent of a spill. If they do not have the resources, the government regulatory agencies responsible for disaster mitigation become involved and oversee the activity. In all spills, the government agencies play a key role in ensuring the environmental protection laws are being met. To limit the areas affected by the spill and facilitate containment and cleanup efforts, a number of factors have to be identified.
- Spill location
- Size and extent of the spill
- Direction and magnitude of oil movement
- Wind, current and wave information for predicting future oil movement
Why remote sensing?
Remote sensing offers the advantage of being able to observe events in remote and often inaccessible areas. For example, oil spills from ruptured pipelines, may go unchecked for a period of time because of uncertainty of the exact location of the spill, and limited knowledge of the extent of the spill. Remote sensing can be used to both detect and monitor spills.
For ocean spills, remote sensing data can provide information on the rate and direction of oil movement through multi-temporal imaging, and input to drift prediction modelling and may facilitate in targeting clean-up and control efforts. Remote sensing devices used include the use of infrared video and photography from airborne platforms, thermal infrared imaging, airborne laser fluourosensors, airborne and space-borne optical sensors, as well as airborne and spaceborne SAR. SAR sensors have an advantage over optical sensors in that they can provide data under poor weather conditions and during darkness. Users of remotely sensed data for oil spill applications include the Coast Guard, national environmental protection agencies and departments, oil companies, shipping industry, insurance industry, fishing industry, national departments of fisheries and oceans, and departments of defence.
Data requirements
The key operational data requirements are fast turnaround time and frequent imaging of the site to monitor the dynamics of the spill. For spill identification, high resolution sensors are generally required, although wide area coverage is very important for initial monitoring and detection. Airborne sensors have the advantage of frequent site specific coverage on demand, however, they can be costly. Spills often occur in inclement weather, which can hinder airborne surveillance.
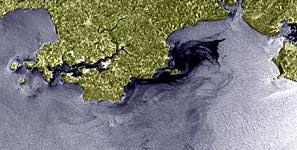
Laser fluorosensors are the best sensors for oil spill detection, and have the capability of identifying oil on shores, ice and snow, and determining what type of oil has been spilled. However, they require relatively cloud free conditions to detect the oilspill. SAR sensors can image oilspills through the localized suppression of Bragg scale waves. Oilspills are visible on a radar image as circular or curvilinear features with a darker tone than the surrounding ocean. The detection of an oilspill is strongly dependent upon the wind speed. At wind speeds greater than 10 m/s, the slick will be broken up and dispersed, making it difficult to detect. Another factor that can play a role in the successful detection of an oilspill is the difficulty in distinguishing between a natural surfactant and an oilspill. Multi-temporal data and ancillary information can help to discriminate between these two phenomena.
Case study (example)
A supertanker, the Sea Empress, was grounded near the town of Milford Haven, Wales on February 15, 1996. After hitting rocks, the outer hull was breached and approximately 70,000 tonnes of light grade crude oil was dispersed southward under storm conditions.
 In this RADARSAT image taken a week after the spill, the extent of the oil is visible. The dark areas off the coast represent the areas where oil is present and areas of lighter tone directly south are areas where dispersant was sprayed on the oil to encourage emulsification. Oil, which floats on the top of water, suppresses the ocean's capillary waves, creating a surface smoother than the surrounding water. This smoother surface appears dark in the radar image. As the oil starts to emulsify and clean-up efforts begin to take effect, the capillary waves are not as effectively damped and the oil appears lighter. Size, location and dispersal of the oil spill can be determined using this type of imagery.
| Updated2002-08-21 | Important Notices |
