
| Table of Contents |
| 1. Introduction 2. Sensors 3. Microwaves 4. Image Analysis |
|
5. Applications |
Fundamentals of Remote Sensing
5.9.1 Ocean Features
Background
Ocean feature analysis includes determining current strength and direction, amplitude and direction of surface winds, measuring sea surface temperatures, and exploring the dynamic relationship and influences between ocean and atmosphere. Knowledge of currents, wind speed, tides, storm surges and surface wave height can facilitate ship routing. Sea floor modelling supports waste disposal and resource extraction planning activities.
Ocean circulation patterns can be determined by the examination of mesoscale features such as eddies, and surface gravity waves. This knowledge is used in global climate modelling, pollution monitoring, navigation and forecasting for offshore operations.
Why remote sensing?
Remote sensing offers a number of different methods for acquiring information on the open ocean and coastal region. Scatterometers collect wind speed and direction information, altimeters measure wave height, and identify wind speed. Synthetic aperture radar (SAR) is sensitive to spatially varying surface roughness patterns caused by the interaction of the upper ocean with the atmosphere at the marine boundary layer, and scanning radiometers and microwave sounders collect sea surface temperature data. Buoy-collected information can be combined with remote sensing data to produce image maps displaying such things as hurricane structure with annotated wind direction and strength, and wave height. This information can be useful for offshore engineering activities, operational fisheries surveillance and storm forecast operations.
Data requirements
For general sea-state information (waves, currents, winds), the data are usually time sensitive, meaning that the information is only valuable if it is received while the conditions exist. For forecasting and ship routing, real time data handling / turnaround facilities are necessary, requiring two way data links for efficient dissemination between the forecast centre and data user.
Certain wind speed conditions are necessary in order for the SAR to receive signal information from the ocean surface. At very low wind speeds (2-3m/s) the SAR is not sensitive enough to detect the ocean 'clutter' and at very high winds speeds (greater than 14 m/s) the ocean clutter masks whatever surface features may be present. The principal scattering mechanism for ocean surface imaging is Bragg scattering, whereby the short waves on the ocean surface create spatially varying surface patterns. The backscatter intensity is a function of the incidence angle and radar wavelength, as well as the sea state conditions at the time of imaging. The surface waves that lead to Bragg scattering are roughly equivalent to the wavelength used by RADARSAT. (5.3 cm) These short waves are generally formed in response to the wind stress at the upper ocean layer. Modulation in the short (surface) waves may be caused by long gravity waves, variable wind speed, and surface currents associated with upper ocean processes such as eddies, fronts and internal waves. These variations result in spatially variable surface roughness patterns which are detectable on SAR imagery.
Case study (example)
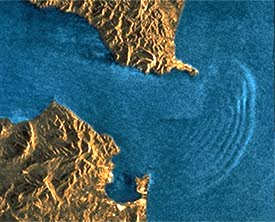 Internal waves form at the interfaces between layers of different water density, which are associated with velocity shears (i.e., where the water above and below the interface is either moving in opposite directions or in the same direction at different speeds). Oscillations can occur if the water is displaced vertically resulting in internal waves. Internal waves in general occur on a variety of scales and are widespread phenomena in the oceans. The most important are those associated with tidal oscillations along continental margins. The internal waves are large enough to be detected by satellite imagery. In this image, the internal waves, are manifested on the ocean surface as a repeating curvilinear patterns of dark and light banding, a few kilometres east of the Strait of Gibraltar, where the Atlantic Ocean and Mediterranean Sea meet. Significant amounts of water move into the Mediterranean from the Atlantic during high tide and/or storm surges.
![]()

![]()
| Updated2002-08-21 | Important Notices |